Iceberg Chart Teaching Strategy | Facing History & Ourselves
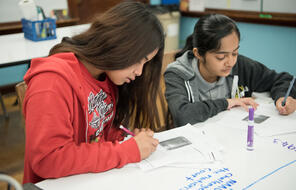
Student writes in a classroom
Teaching Strategy

Iceberg Diagrams

Encourage students to recognize the multiple causal factors behind an event from history, the present, or literature, using the visual of an iceberg.

Published:

At a Glance

Teaching Strategy

Language

English — US

Subject

  • English & Language Arts
  • History
  • Social Studies

Grade

6–12

Overview

What Is an Iceberg Diagram?

The Iceberg Diagrams teaching strategy helps students gain awareness of the numerous underlying causes that give rise to an event. It’s often difficult for students to see these causes because they rest “beneath the surface.” The visual image of an iceberg helps students remember the importance of looking deeper than the surface in order to better understand events in the past or present. This strategy can be used as a way for students to organize their notes as they learn about a period in history, as a way to review material, or as an assessment tool.

Save this resource for easy access later.

Save resources to create collections for your class or to review later. It's fast, easy, and free!
Have a Workspace already? Log In

Lesson Plans

How to Use Iceberg Diagrams

Select an event that students are exploring in class. It can be an event from literature, history, or recent news. Students should already be familiar with this event.

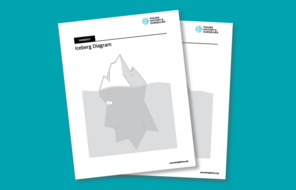
Ask students to list what they know about icebergs, or you can show them a picture of an iceberg. The main idea you want to establish is that what one sees above the water is only the tip of the iceberg; the larger foundation rests below the surface. Then ask students to draw an iceberg on a piece of paper or in their journals, making sure that there is a tip, a water line, and a larger area below the surface. Their drawings should be large enough so that students can take notes within the iceberg. Alternatively, you can distribute the iceberg template located in the handout section.

Ask students to list everything they know about the facts of a selected event in the “tip” area of the iceberg. Questions they should answer include: What happened? What choices were made in this situation? By whom? Who was affected? When did it happen? Where did it happen?

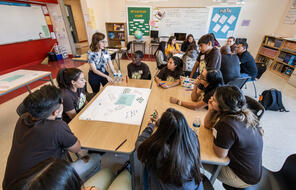
Ask students to think about what caused this event. In the bottom part of the iceberg (under the water), they should write answers to the question, “What factors influenced the particular choices made by the individuals and groups involved in this event?” These factors might include events from the past (i.e., an election, an economic depression, a natural disaster, a war, an invention) or aspects of human behavior or nature such as fear, obedience to authority, conformity, or opportunism. This step is often best done in groups so that students can brainstorm ideas together.

Prompts you might use to guide journal writing and/or class discussion include:

  • What did you learn from completing your iceberg?
  • Of the causes listed in the bottom part of the iceberg, which one or two do you think are most significant? Why?
  • What more would you need to know to better understand why this event took place?
  • What could have been done, if anything, to prevent this event from happening?
  • What have you learned about how to prevent similar events from happening in the future?
  • How does the information in this iceberg help you better understand the world we live in today?

Variations

As a final test for a unit, you could have students complete iceberg diagrams for a particular event you have studied. You might have students write a companion essay explaining the ideas they included in the bottom part of the iceberg.

Have students complete iceberg templates for events as you study them throughout the year. Periodically, ask students to compare these templates, recognizing similarities and differences among the factors that give rise to particular events. This exercise can help students notice historical patterns while also appreciating the particular context that makes each event unique.

Rather than having students complete their iceberg as one class lesson or homework assignment, you can have students complete the diagrams in a more continuous way as you study a period in history. You can even post a class version of the iceberg on the classroom wall. As students learn new information, they can add it to this classroom iceberg.

A similar strategy helps students analyze events by using a diagram of a tree instead of an iceberg. In this variation, students record basic facts about the event in the trunk of the tree (name of event, when it happened, where). The different people involved in the event (bystanders, perpetrators, victims, upstanders) are listed in the branches of the tree. Sometimes teachers have students draw a line connecting each person or group to a choice he/she/they made related to this event. Finally, the causes of the event are listed in the “roots” section.

Use the Iceberg Diagrams strategy as a way to help students explore current events. Have them bring in a story from a newspaper or online source. Working in small groups, students can complete an iceberg diagram for this event, recording details about what happened and then ideas about what they think caused the event. Finally, students can present their iceberg diagrams to the larger class.

You might also be interested in…

Unlimited Access to Learning. More Added Every Month.

Facing History & Ourselves is designed for educators who want to help students explore identity, think critically, grow emotionally, act ethically, and participate in civic life. It’s hard work, so we’ve developed some go-to professional learning opportunities to help you along the way.

Most teachers are willing to tackle the difficult topics, but we need the tools.
— Gabriela Calderon-Espinal, Bay Shore, NY